Feature Importance for regression
#linear regression feature importance
from sklearn.datasets import make_regression
from sklearn.linear_model import LinearRegression
from matplotlib import pyplot
# define dataset
X, y = make_regression(n_samples=1000, n_features=10, n_informative=5, random_state=1)
# define the model
model = LinearRegression()
# fit the model
model.fit(X, y)
# get importance
importance = model.coef_
# summarize feature importance
for i,v in enumerate(importance):
print('Feature: %0d, Score: %.5f' % (i,v))
# plot feature importance
pyplot.bar([x for x in range(len(importance))], importance)
pyplot.show()
feature importance for classification
# test classification dataset from sklearn.datasets import make_classification # define dataset X, y = make_classification(n_samples=1000, n_features=10, n_informative=5, n_redundant=5, random_state=1) # summarize the dataset print(X.shape, y.shape) Decision Tree Feature ImportanceDecision tree algorithms like classification and regression trees (CART) offer importance scores based on the reduction in the criterion used to select split points, like Gini or entropy. This same approach can be used for ensembles of decision trees, such as the random forest and stochastic gradient boosting algorithms. Let’s take a look at a worked example of each. CART Feature ImportanceWe can use the CART algorithm for feature importance implemented in scikit-learn as the DecisionTreeRegressor and DecisionTreeClassifier classes. After being fit, the model provides a feature_importances_ property that can be accessed to retrieve the relative importance scores for each input feature. Let’s take a look at an example of this for regression and classification. CART Regression Feature ImportanceThe complete example of fitting a DecisionTreeRegressor and summarizing the calculated feature importance scores is listed below.
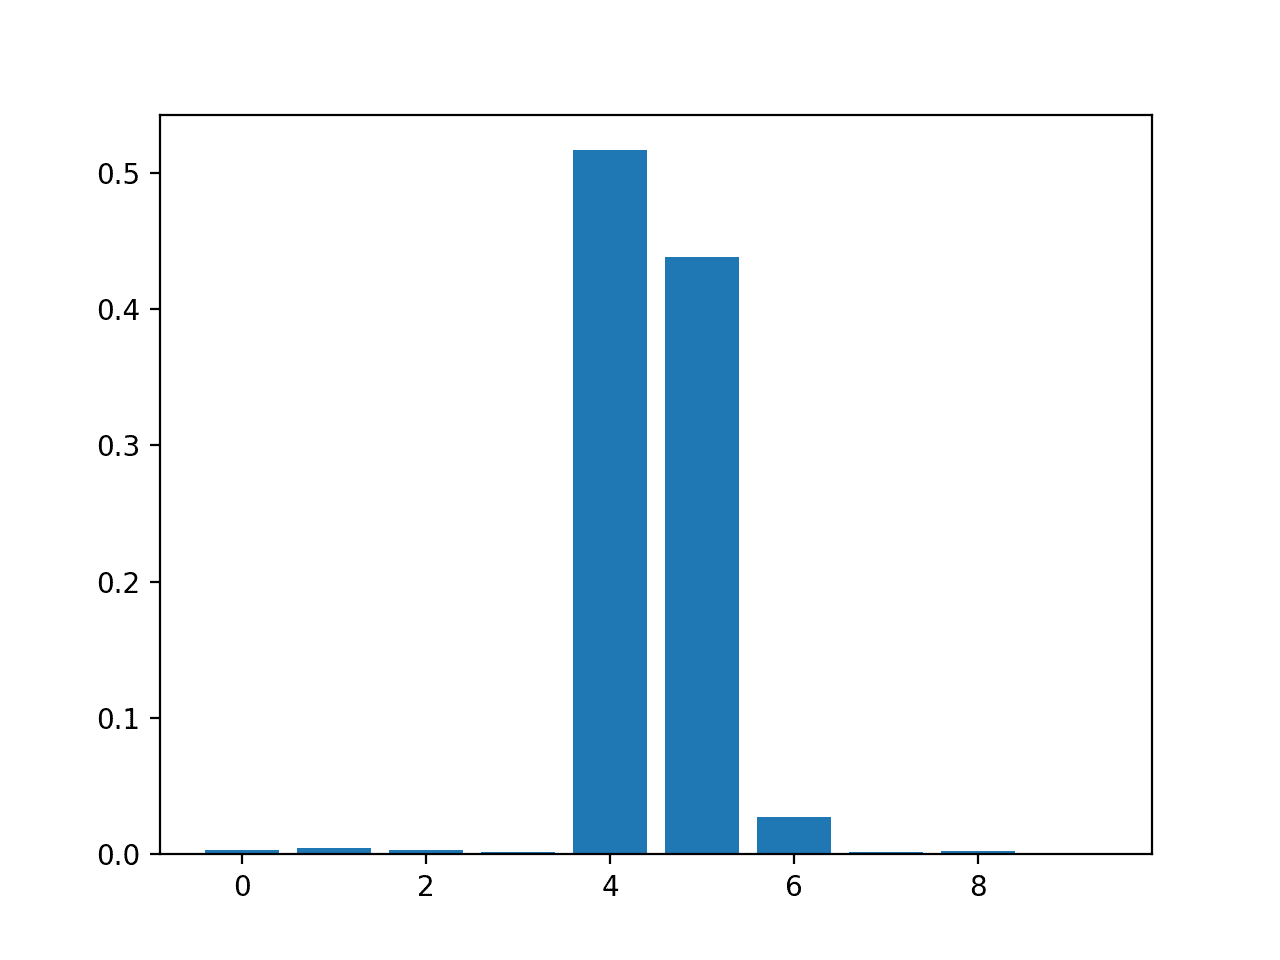
Running the example fits the model, then reports the coefficient value for each feature. Note: Your results may vary given the stochastic nature of the algorithm or evaluation procedure, or differences in numerical precision. Consider running the example a few times and compare the average outcome. The results suggest perhaps three of the 10 features as being important to prediction.
A bar chart is then created for the feature importance scores.  Bar Chart of DecisionTreeRegressor Feature Importance Scores CART Classification Feature ImportanceThe complete example of fitting a DecisionTreeClassifier and summarizing the calculated feature importance scores is listed below.
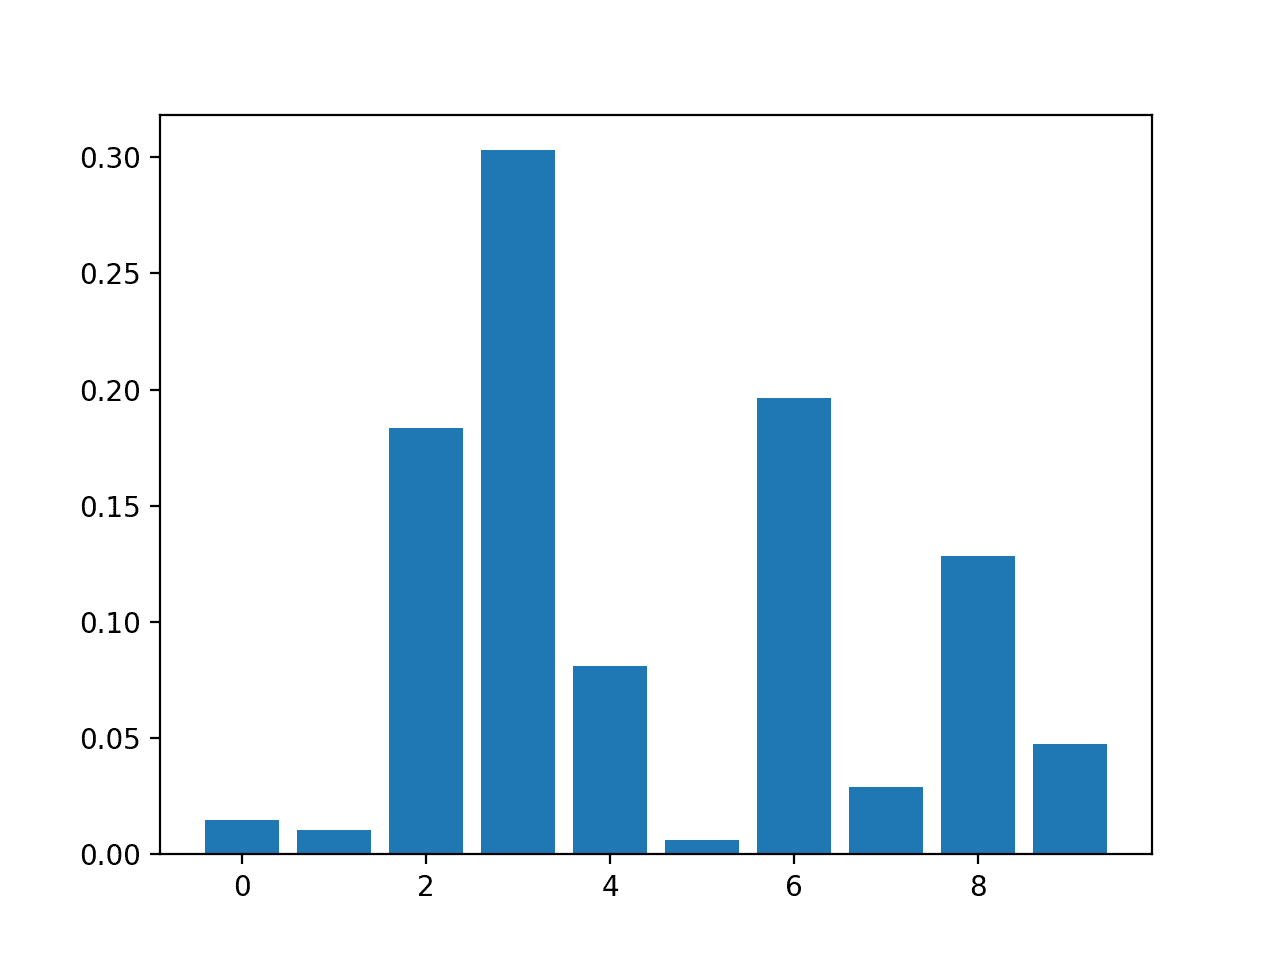
Running the example fits the model, then reports the coefficient value for each feature. Note: Your results may vary given the stochastic nature of the algorithm or evaluation procedure, or differences in numerical precision. Consider running the example a few times and compare the average outcome. The results suggest perhaps four of the 10 features as being important to prediction.
A bar chart is then created for the feature importance scores.  Bar Chart of DecisionTreeClassifier Feature Importance Scores Random Forest Feature ImportanceWe can use the Random Forest algorithm for feature importance implemented in scikit-learn as the RandomForestRegressor and RandomForestClassifier classes. After being fit, the model provides a feature_importances_ property that can be accessed to retrieve the relative importance scores for each input feature. This approach can also be used with the bagging and extra trees algorithms. Let’s take a look at an example of this for regression and classification. Random Forest Regression Feature ImportanceThe complete example of fitting a RandomForestRegressor and summarizing the calculated feature importance scores is listed below.
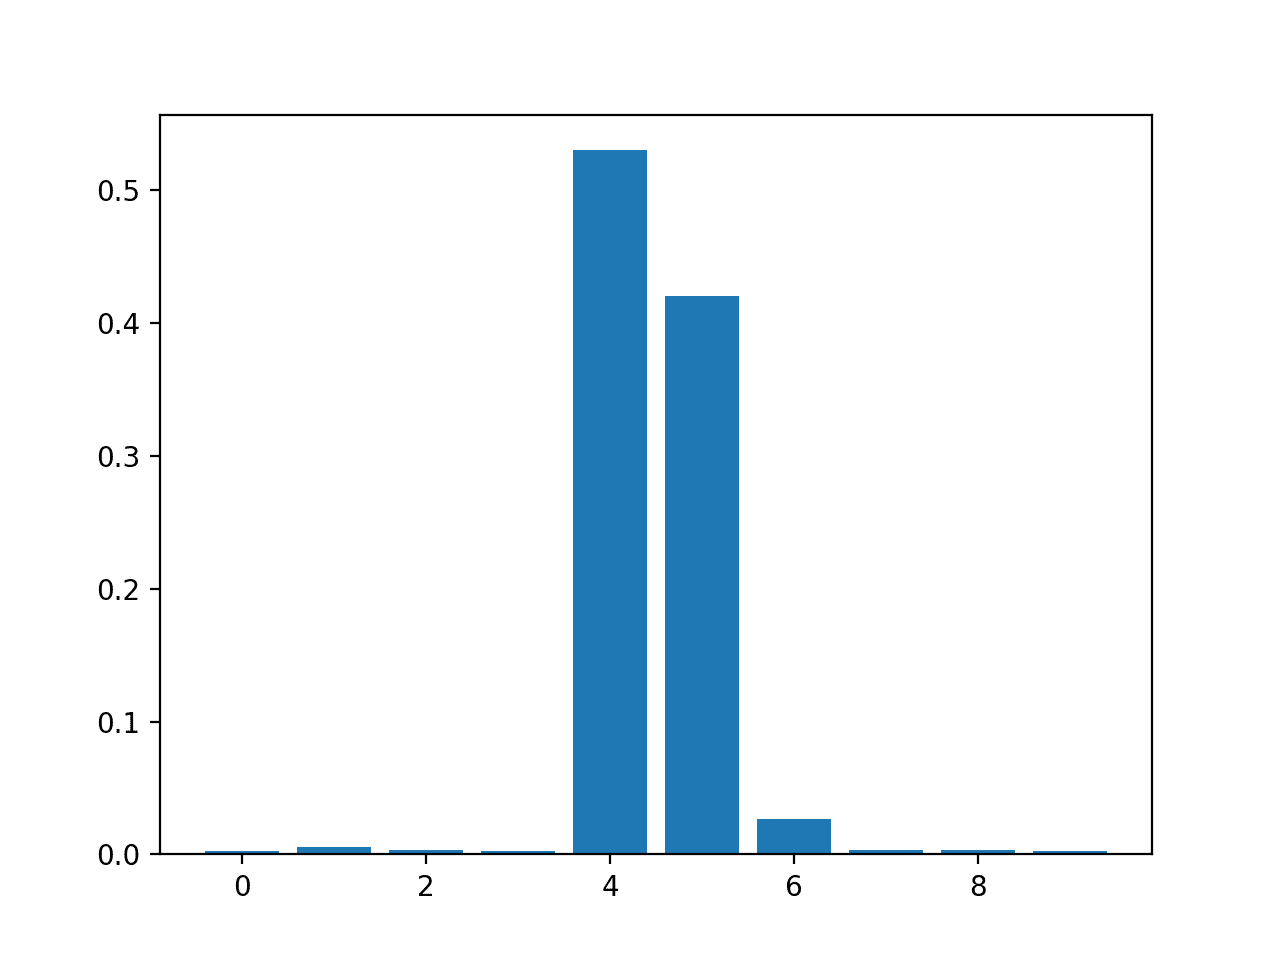
Running the example fits the model, then reports the coefficient value for each feature. Note: Your results may vary given the stochastic nature of the algorithm or evaluation procedure, or differences in numerical precision. Consider running the example a few times and compare the average outcome. The results suggest perhaps two or three of the 10 features as being important to prediction.
A bar chart is then created for the feature importance scores.  Bar Chart of RandomForestRegressor Feature Importance Scores Random Forest Classification Feature ImportanceThe complete example of fitting a RandomForestClassifier and summarizing the calculated feature importance scores is listed below.
Running the example fits the model, then reports the coefficient value for each feature. Note: Your results may vary given the stochastic nature of the algorithm or evaluation procedure, or differences in numerical precision. Consider running the example a few times and compare the average outcome. The results suggest perhaps two or three of the 10 features as being important to prediction. |
- Get link
- X
- Other Apps
- Get link
- X
- Other Apps
Comments
Post a Comment